Imperial College of London’s study on renewable energy stock returns
A team at the Imperial College of London’s business school ran a multi-country analysis. They compared the returns from each country’s largest fossil fuel and renewable energy stocks over the last 10 years. It’s a good read – Energy Investing: Exploring Risk and Return in the Capital Markets.
They found that in all three countries renewable energy stocks delivered higher returns (you can see the full results below). This was true for both 5 and 10 year time periods. The best part is that this study was conducted before the Covid-19 market crash.
The researchers tried to include as many companies as possible in their study. For both categories, in order to be included, the company had to have a market capitalization above $200 million (aka above micro cap). The number of companies included in the study differed considerably in each region.
The study looked at stock markets in three regions: Germany & France, the UK, and the US. For each we’ll start by orienting you to what stood out to us in the data, then present their findings, and conclude with some speculation on why the two stock groups performed as they did in that region.
Before we get to the results, let’s define some terms:
- Total Return: Increase (or decrease) in stock price + all dividends reinvested
- AAR: Average Annual Return which is the average of the Total Return over a given time period. It includes dividends.
- Annualized Volatility: This is the standard deviation. Basically, the higher the number, the more volatile (which is generally bad).
Germany & France
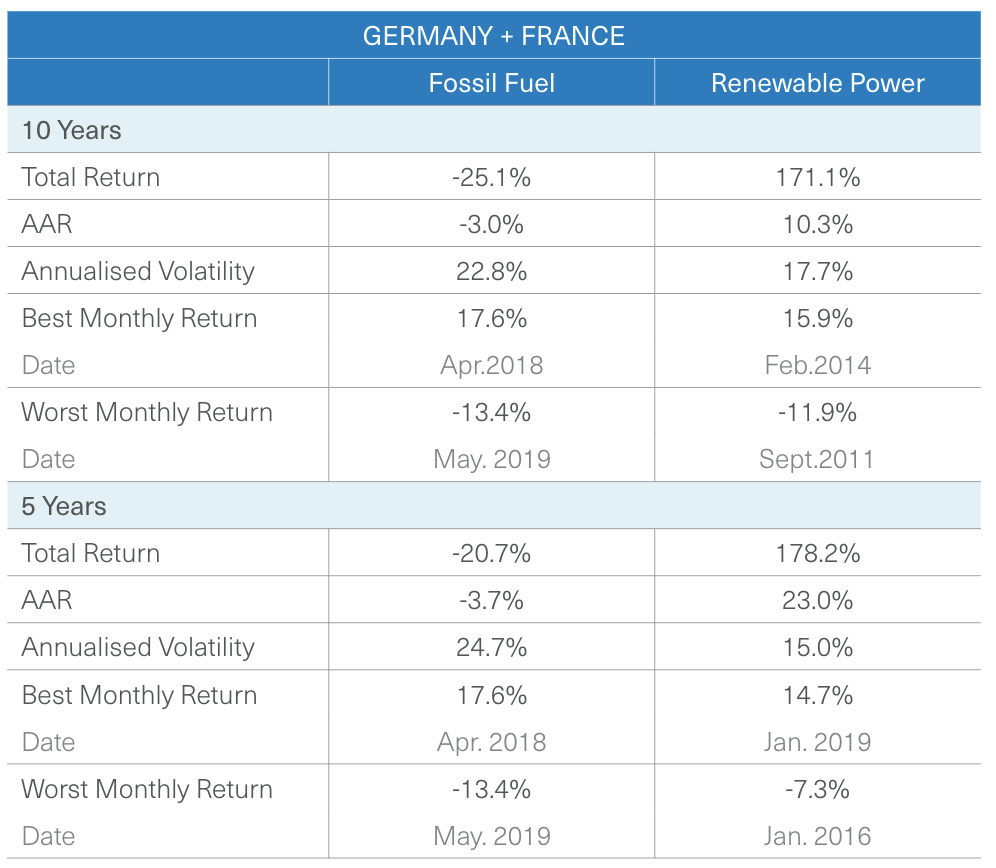
Germany and France is the only region in the study that had more renewable energy companies (11) than fossil fuel companies (5). While that’s mildly surprising, the fossil fuel companies that did make the cut were far larger (and likely more consolidated) with an average market capitalization of €24.9 Billion. The renewable energy companies had an average market cap of €1.15 Billion.
What stands out to us: Germany and France have the greatest spread between fossil fuel and renewable energy stocks. Throughout the decade, fossil fuel stocks seem to have fairly consistently lost their investor money.
What’s promising for renewable energy investors in Germany and France was the lower volatility of these stocks. Generally, volatility is what investors use to gauge risk.
A simple method of evaluating the performance of a stock or portfolio is to compare its Average Annual Return (AAR) to its Annualized Volatility (risk). If AAR is higher than Volatility, that stock performed well over that time period. You see this if you look at the 5 Year AAR and Volatility for Renewable Power.
While we would want to see a longer time period of data, investors use these numbers to “read the tea leaves” of what could happen in the future. The Annualized Volatility (risk) is in standard deviations. So for the 10 year time period for renewable energy, we would expect that ~68% of the time, the stock would not deviate by more than 17.7%. And that 95% of the time it would not deviate by more than 35.4%.
As you can see for the Fossil Fuel stocks during this time period, investors in them had taken on considerably more risk with far less reward.
Our speculation: Why did the results turn out this way? While there are certainly many reasons for these trends, here is our (lightweight) analysis.
Germany and France both have aggressive pro-renewable policies. Their governments have been more proactive in putting climate-forward legislation in place. France even briefly passed a carbon tax.
Germany’s climate action plan, Klimaschutzplan 2050, was put in place following the Paris Climate Accord. This pushed the country to phase out coal and invest heavily in renewables.
(Side note: We wish Germany had embraced nuclear energy like their neighbor in France. They are expanding renewables, but also decommissioning their entire fleet of nuclear plants and replacing them with natural gas and coal…)
Capitalism is built upon growth. Given that the governments of both of these countries have put in policies to wind down fossil fuels and rapidly expand renewable energy, it makes sense that investors would bet on the latter and against the former.
The UK
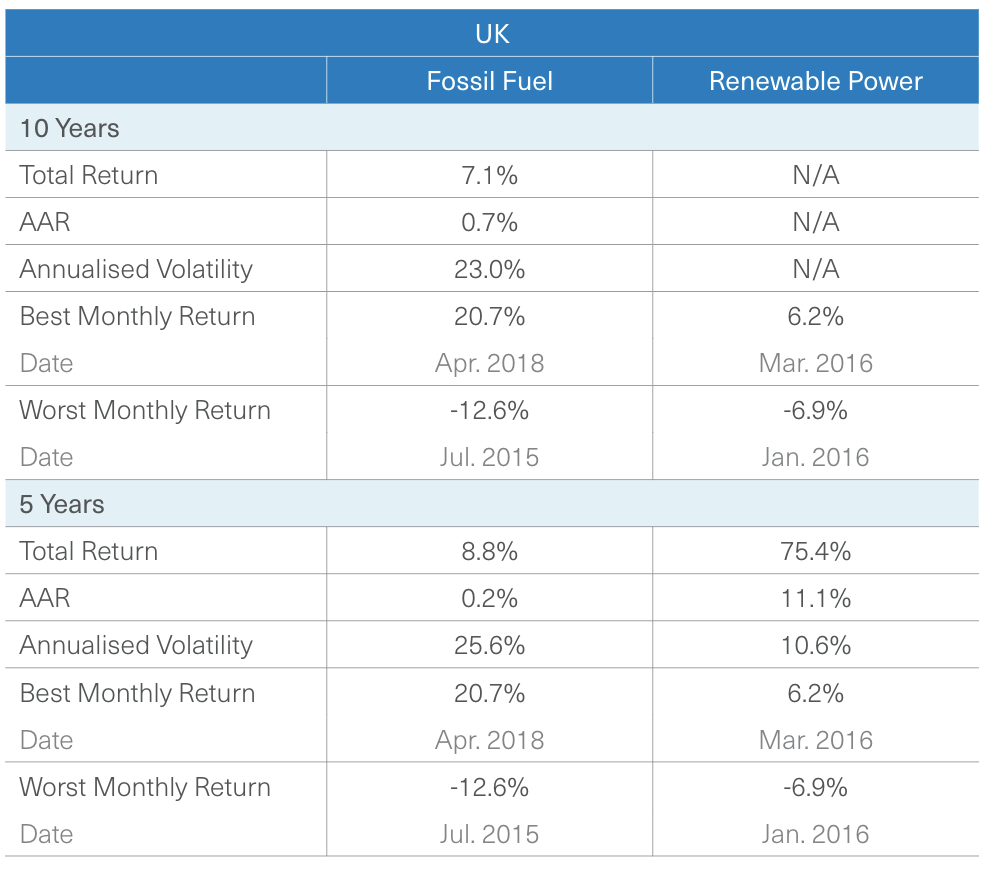
The UK portfolio compared 26 Fossil Fuel with 11 Renewable energy stocks. The average market capitalization of the fossil fuel companies was £6.29 B, with the renewable energy co’s coming in at £1.28 B.
There was not enough 10 year data from the renewable energy stocks for that comparison. Not enough of the companies studied had gone public yet. But we can still look at fossil fuel stocks.
What stands out to us: Unlike Germany and France, the Fossil Fuel co’s managed to not lose their investors money over both the five and 10 year periods. That said, they didn’t make them very much either. Like Germany and France, fossil fuel investors took on considerably more risk than the gain they received.
Also like Germany and France, the last five years saw British renewable energy companies deliver higher returns than their expected risk (annualized volatility).
Our speculation: Why did the results turn out this way?
Our first question (*asks Google*), when was the BP oil spill? At the beginning of the decade in 2010. Ok, that could explain poor performance for the fossil fuel stocks at the beginning of the decade. But it looks like their flatline performance was consistent across both time periods.
Beginning in 2015, global natural gas prices fell. They recovered but were about 25% lower than the first half of the decade. At the same time, BP’s shares never recovered from the Deep Water Horizon spill.
The British Government has operated more conservatively than its European neighbors in cutting emissions. Perhaps this weaker signal to the investment community helped keep fossil fuel prices afloat.
The United States
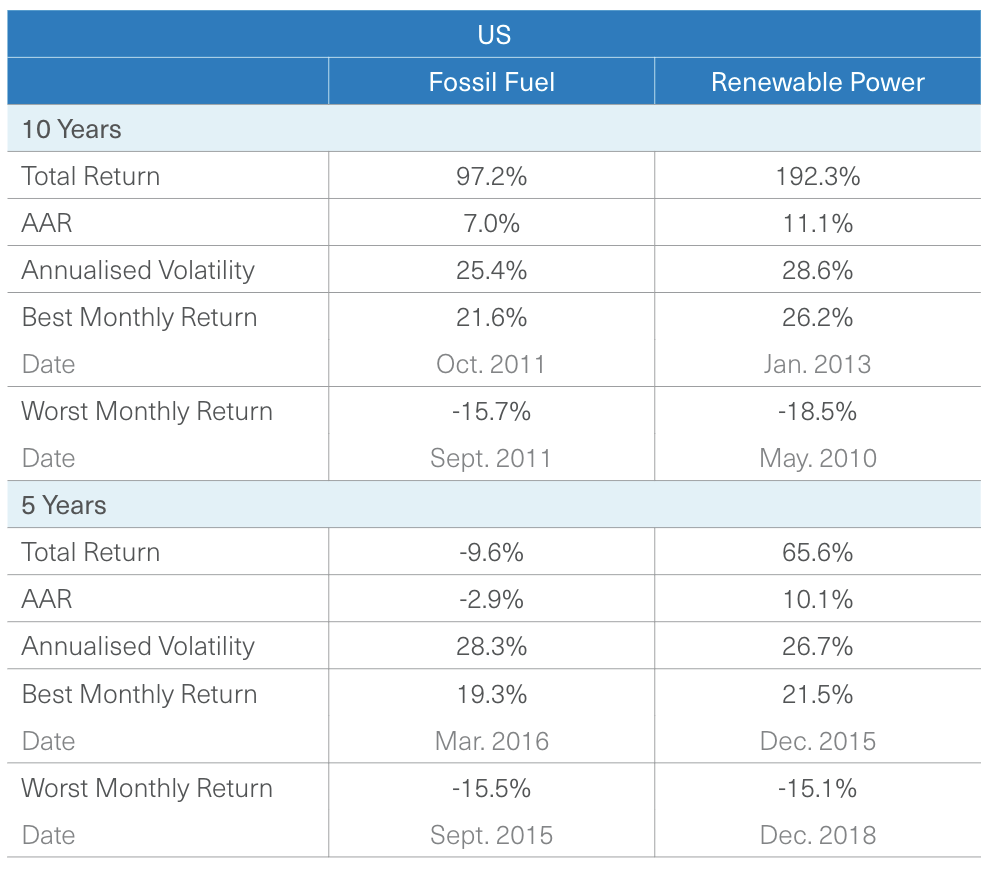
Last but not least… Here are the results from the US. America has far more oil companies than its European counterparts: 163 made the cut, with an average market cap of $9.90 B. This compares to 18 renewable energy companies with an average market cap of $2.48 B.
What stands out to us: Unlike the other countries, the fossil fuel stocks generated a decent 10-year return with a 7.0% AAR (before Covid-19). But it wasn’t as strong as renewables. Renewable energy companies generated an 11.1% return over the same time period.
Notably, both categories underperformed the total S&P 500 with an annualized return of 13.86% from 02/12/10 – 02/12/20.
If we zoom in to five years, we clearly see that the first half of the 2010s is where the fossil fuel stocks made their gains as their returns went negative in the second half. Renewable energy stocks had pretty consistent numbers across both comparisons.
This point is worth focusing on. Looking forward, renewable energy stocks’ consistent performance over the decade is quite promising. Such a trend can help new investors get into the space.
The one negative worth calling out is the sector’s consistently high volatility. Over both time periods its volatility was far higher than its annualized returns. While things ended up going well for renewable energy in both of these examples, this volatility is something to look out for in the future as it signals that investors were quick to both buy and sell, rather than buy and hold.
Our speculation: Why did the results turn out this way?
The first half of the 2010’s saw a US energy revolution. Fracking and natural gas took off in a way they never had historically. This graph takes a second to parse. In 2008, the US was producing ~7.78m barrels of oil a day. By 2019 we were producing 19.33m barrels! That’s a 2.5x increase. Net imports had dropped to practically zero. (Source = US Energy Information Administration)
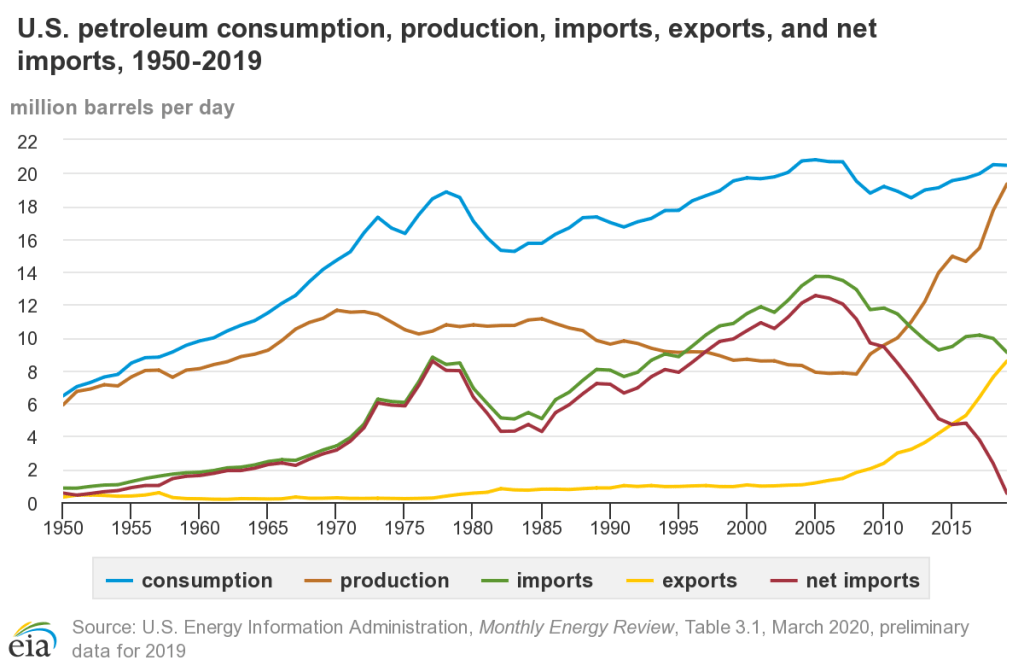
So, the decent performance of fossil fuel stocks in the first half of the decade could be explained by this rise in domestic production.
But why didn’t their shares continue to climb, as domestic production rose further? There’s a few potential reasons:
- Oversupply. Frackers went too fast. Supplies rose faster than demand could meet it. Prices fell for both natural gas and oil.
- Earthquakes. Frackers started to get significant blowback for their damaging environmental practices. In 2015, Oklahoma had almost 1,000 3.0+ earthquakes. Before fracking Oklahoma almost never had earthquakes above 3.0.
- Paris Climate Accord. The agreement was signed in 2015. Even though Trump backed the US out of it, it could have sent a signal that the days of fossil fuel expansion were numbered.
- Divestment. The line between correlation and causation is hard to pinpoint here, but the push for divestment from fossil fuels rapidly accelerated over the second half of the decade. One of the first big moves came in 2014 when the Rockefeller family fund opted to divest from oil. By 2020, Jim Cramer, arguably the most famous stock picker on television had this to say:
“Look at BP; it’s a solid yield, very good. Look at Chevron; they’re buying back $5 billion worth of stock. Nobody cares. This has to do with new kinds of money managers who frankly just want to appease younger people.”
And why did the renewable energy stocks do well? The pattern of pretty consistent returns over the decade is the same across all of these markets.
This point is worth making again: Capitalism is built upon growth. In the US, renewable energy represents 17.5% of our total electricity grid, with the majority of that begin hydro power. Solar currently makes up less than 2%. If we’re going to transition our grid to zero carbon it will need to make up at least 30% if not more.
Gut check: comparing renewable energy & fossil fuel ETFs
How much should we trust this study? We can’t quite double check their work, but we can get close.
To gut check this study we compared the returns from two ETFs:
- VDE – Vanguard’s energy sector ETF
- QCLN – First Trust’s clean energy ETF
Our goal was to find the funds that were as “apples to apples” as possible. VDE is focused on the US energy sector. QCLN holds a few Chinese companies, but 87% is focused in North America. We chose QCLN over the more popular ICLN because ICLN is globally focused with only 44% US-companies.
There are two differences with these portfolios and the study that are worth pointing out in advance:
- Portfolio. The study used a different methodology than these funds. They seem to be close, but not 100% overlapping.
- Timing. The study indicates the months, but not exact dates it took the data from. We had to make some assumptions
- Fees. These ETFs charge annual fees that get deducted from their share price. In some ways, our analysis favors VDE compared to QCLN. VDE charges 0.10%/year. QCLN charges 0.60%. These ratios are automatically factored into the share price, so all results we show are after the fund fees have been taken out.
The study ran from “January 2010 – December 2019” so we looked at data from 01/01/2010 – 12/31/19. The stock market hit its high before the Covid-19 crash on February 12, 2020.
Let’s look at the results.
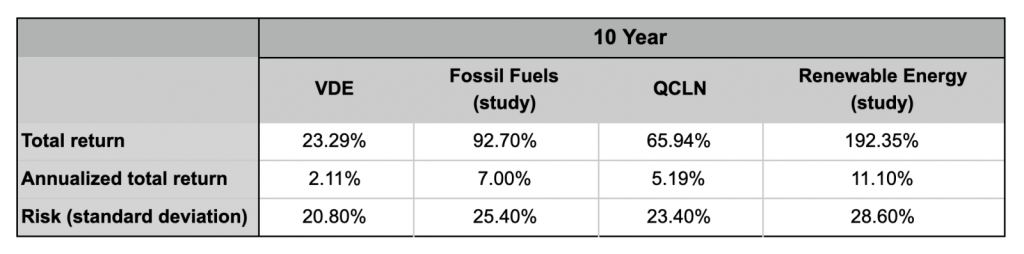
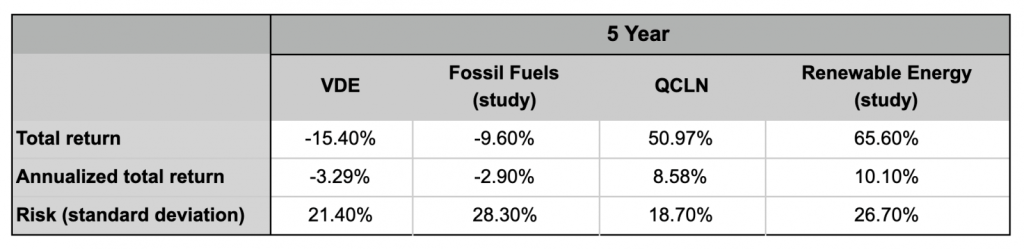
Clearly, these numbers are not a perfect overlap. Some standout differences:
- The 10 year returns for fossil fuels in the study did far better than VDE
- Similarly the 5 year returns for fossil fuel stocks in the study did better than VDE
- Investors in QCLN took on less risk (especially over the five year period) than the collection of stocks in the study.
But overall, the patterns match the study:
- The overall 10 year returns for the fossil fuel industry were positive, while over the five year period the returns were negative.
- The renewable energy industry returns were positive during both time timeframes and quite close over the five year period.
Given that we could not easily exactly replicate the study, the results of our gut check our promising. While our numbers differed, we found the same general trends as the study. Renewable energy far outperformed fossil fuels.
Conclusion
So before the Covid-19 crash, and certainly afterwards, renewable energy stocks in the US and also in the UK, France, and Germany did far better than fossil fuel stocks.
The difference in Europe was more stark than here in the US. But in the US, both the study and our gut check using roughly analog ETFs showed the same results: renewable energy companies did better.
We should point out that 2020, as of 10/01/2020, has been a great year for renewable stocks in the US and a dismal one for fossil fuels. From 01/01/2020 – 10/01/2020 here’s how the two funds in our gutcheck have performed. Remember, this includes dividends:
- VDE (energy): -49.45%
- QCLN (renewables): 82.60%
Will they continue this way? Who knows. Nobody can predict the future. But if your assumption about the world is that renewable energy will grow, then you may want to align your investment strategy accordingly.
Remember, your investments matter. This is especially true for long term investors.
About Carbon Collective
We built Carbon Collective after we couldn’t find anywhere to invest our retirement savings that made both ethical and financial sense in the age of climate change.
So we built the world’s first climate-friendly, diversified, low-fee investment portfolios and teamed up with a world-class online brokerage platform to automatically manage them.
Imagine an index fund for a world without fossil fuels. That’s how we build our portfolios. We replace the high-carbon parts of the stock market (fossil fuels, dirty utilities, airlines, etc.) with the companies building solutions to climate change (renewable energy, circular economy, energy efficiency, etc.).
Check out their historical performance, carbon footprint, and fees compared to some common standard and ethical portfolios.
