Stock market sector overview
There are multiple ways to group the thousands of companies in the stock market. You can group by size (S&P 500). You can group by location (national vs. international). Or, you can group by stock market sector, lumping companies together by category based upon their product or service.
This last approach nicely groups the public companies with high carbon emissions together.
The four high-carbon sectors are: utilities, energy, materials, and industrials. In September 2020, these sectors represented 19% of the total stock market, but were responsible for 85% of its CO2e emissions.
The seven low-carbon sectors are: technology, healthcare, real estate, consumer discretionary, consumer staples, financials, and communications. In September 2020, these sectors represented 81% of the stock market and were responsible for 15% of the CO2e emissions from all public companies.
How did we get these numbers? Let’s walk through the math.
Where we sourced the size of each market sector
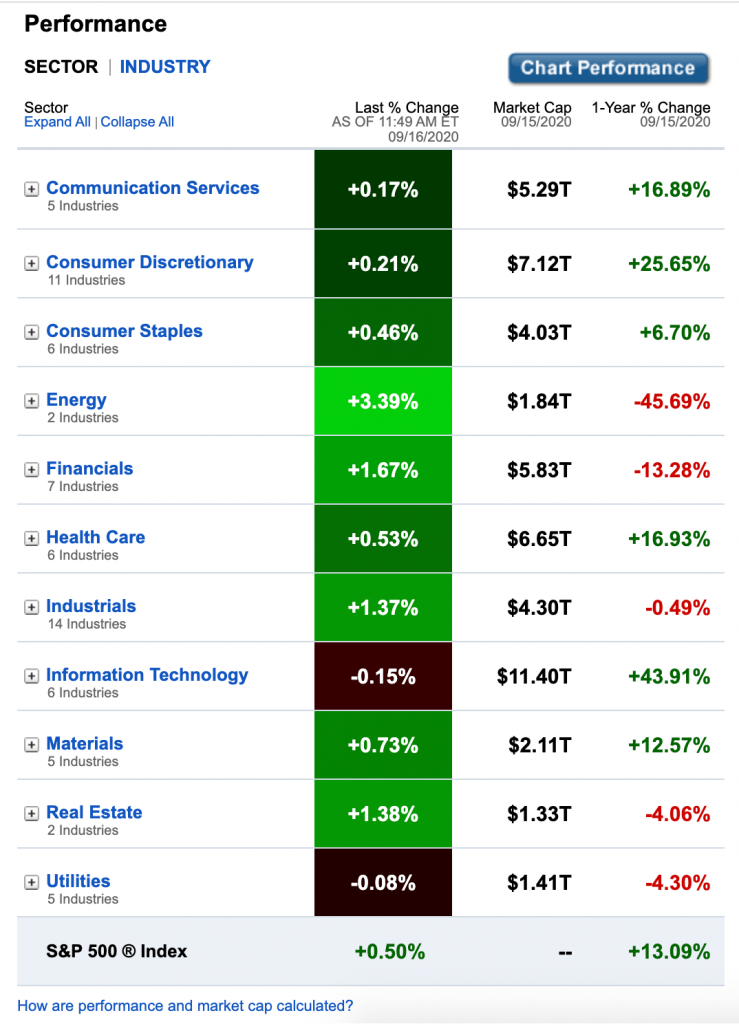
This is relatively simple. Fidelity has built a sector tracking tool for the 11 sectors traded on the New York stock exchange.
The total size of each represents all of the shares of every company in each sector, multiplied by their value (current trading price).
Where company carbon footprint numbers come from
Most public companies hire a carbon analysis firm to tabulate their annual CO2e footprint. They publish these annually in their sustainability reports. Many companies use these numbers to set CO2e reduction goals and track their progress.
Until Fossilfreefunds.org came around, it was pretty challenging to get the full carbon footprint of an ETF (exchange traded funds) or mutual fund.
They partnered with ESG data analytics firm, Your SRI, to build a fund analysis tool. It searches through all the companies in a fund, pulls the CO2e data from each from Your SRI’s database, and multiplies them by how much of the fund each company represents.
This results in four pieces of carbon data on each fund. Let’s break them down quickly.
- Carbon Footprint – CO2e/$1m Invested. This number compares a company’s stock value to its carbon footprint. Under the “ownership principle,” if you own a company’s stock, you own that equivalent amount of impact on the world. On a fund level, this number represents how many tons of CO2e you own if you bought $1million of it.
- Carbon Intensity – CO2e/$1m in revenue generated. This number compares a company’s revenue to its carbon footprint. It doesn’t have any relationship to the stock value, but can be a good indicator of a company’s carbon emissions based upon their day to day business.
- Scope 1 + Scope 2 – CO2e emissions from their direct business activities. Scope 1 = direct emissions. Utilities have much higher Scope 1 emissions than fossil fuel companies because utilities actually burn fossil fuels. Energy companies just extract them and transport them. Scope 2 = the indirect emissions generated from running the company like from electricity.
- Scope 3 – CO2e emitted from using the company’s products or services. Fossil fuel companies have the highest Scope 3 emissions. Unfortunately, there is less publicly available Scope 3 data, so we (and Fossil Free Funds) don’t include it as a metric.
How we calculate the estimated CO2e footprint of each stock market sector
So which of these metrics do we use in our calculations?
We built Carbon Collective because we believe where you invest your savings matters. If you are investing for the long term, you tend to buy and hold a collection of stocks, impacting the global supply. You can slow down fossil fuel companies by divesting from their stock and speed up renewable energy companies by investing in theirs.
Therefore, we use the ownership principle. It relates a company’s current stock price to its relative carbon footprint.
Here’s the CO2e footprint per $1m invested for each sector:
You can scan through all our math and sources for every graph we post in this article here.
As you can see, the top sectors produce significantly more CO2e pollution per $1m invested than the bottom.
Putting sector market size and sector emissions together
Not every sector is the same size, though. Remember, this number is calculated based upon the CO2e emitted per $1m of investment. In order to get to the true carbon emissions per market sector, we need to add back in market size.
We know the emissions per $1m invested in a sector (Fossil Free Funds). We know how many $1ms have been invested into each sector (Fidelity). So, to calculate the estimated CO2e footprint per market sector, we need to multiply them together. (Again, check out our full calculations)
The result:
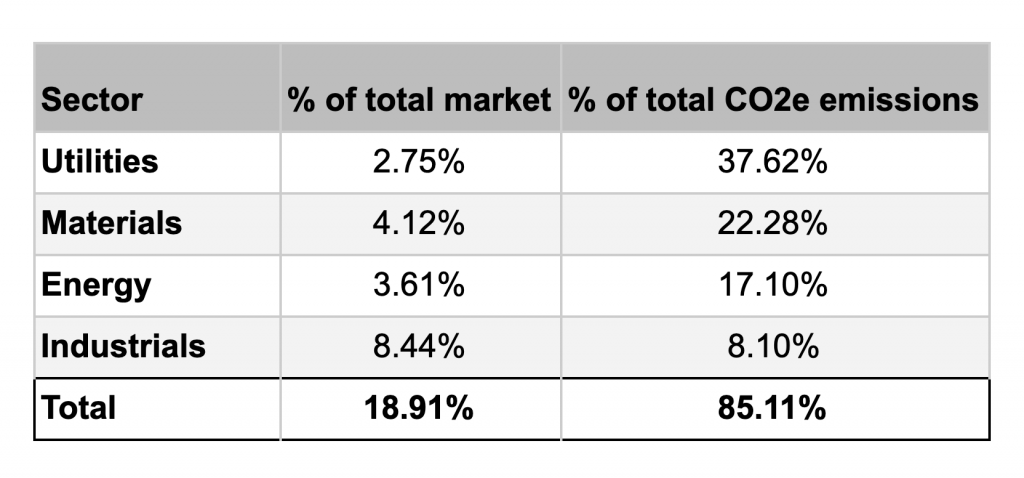
As of 09/14/20, 18.91% of the total value on the stock market was responsible for emitting 85.11% of CO2e emitted by all public companies. See below for a full graph of all sectors sorted from the largest to the smallest on the stock market.
The largest sectors all have relatively small CO2e footprints. Let’s look at it in the other direction, from most polluting to least.
Gut check
In modeling, after you get an answer, you often perform a gut or sanity check. This is an exercise to check your answer against some other source of trusted information.
So, how do our results compare to the real world?
We can perform a simple gut check by looking at the most polluting sector, utilities. According to our calculations, the total emissions from publicly-traded utilities per year is about: 1,517,600,000 metric tonnes of CO2e.
According to the US Energy Information Administration, the total carbon emissions from all utilities in the US is 1,870,000,000 metric tonnes of CO2.
Our calculation checks out. It’s in the same ballpark and is lower. We expected to see this as some utilities in the US are not publicly traded, like regional co-ops.
Advantages and disadvantages of our sector-based approach
Whether you’re looking for the best green investment funds or the best traditional ones, selecting the right investment strategy involves trade-offs. No strategy is perfect.
Let’s explore the advantages and disadvantages of our sector-based approach to eco investing.
Ethical Advantages:
- Zero fossil fuel companies. Cutting out the energy sector entirely guarantees there are no fossil fuel companies. This is one of our greatest frustrations with ESG and sustainable funds: they say they screen out fossil fuel companies, but they often don’t.
- CO2e is a simple, quantitative metric. Similarly, one of our other struggles with ESG investing and eco funds is their selection criteria. It’s unclear why a company is included or not. With CO2e as the driving metric, selecting low-carbon sectors is simple to understand and easy for you to do on your own.
Ethical Disadvantages:
- CO2e is a simple, quantitative metric. The flip-side of using a simple ethical filter is it leaves some companies you may not be as excited about investing in for other ethical reasons (like gender and diversity). In our full climate friendly portfolio, we go a bit further and filter out meat processors, tobacco companies, and private prisons.
Financial Advantages
- Establishes broad market exposure. If you only invested in these seven sector index funds, you would get exposed to 81% of the market. The more exposure a portfolio has, the more you are betting on the entire market going up, not just select stocks or categories. We’re big proponents of investing with index funds, and using sectors is the most climate friendly way we’ve found to do it.
- Low fund expense ratios. Unlike ESG or sustainable ETFs, you don’t pay extra for fund managers to apply ethical criteria to these standard index funds.
Financial Disadvantages:
- Lacks full market exposure. A total-market index fund exposes your portfolio to all of the sectors in the market. The sector-based approach only exposes you to 7/11 of them. In our full portfolio, we make up for this deficit by backfilling the high-carbon sectors with relevant companies building climate solutions.
Conclusion
If you are looking for the best green investment funds, try looking at market-sector index funds. They offer a simple, inexpensive, and straightforward way to reduce 85% of the carbon footprint compared to a market index fund.
We use sector-based index funds as the foundation of our climate friendly investment portfolios. Checkout the next steps we take to construct climate friendly, diversified investment portfolios.
